Satellite Intelligence for Real Decisions
When the land, water, or environment changes — you need to know first.
EOPlatform turns satellite data into practical answers for organisations managing flood risk, land use, environmental compliance, and disaster response. No technical setup required — we do the analysis, you get the insight.
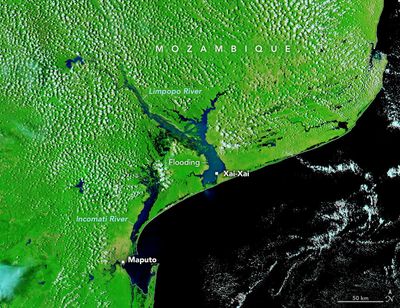
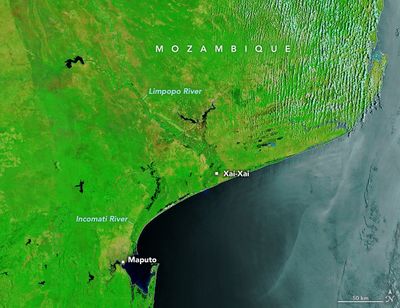
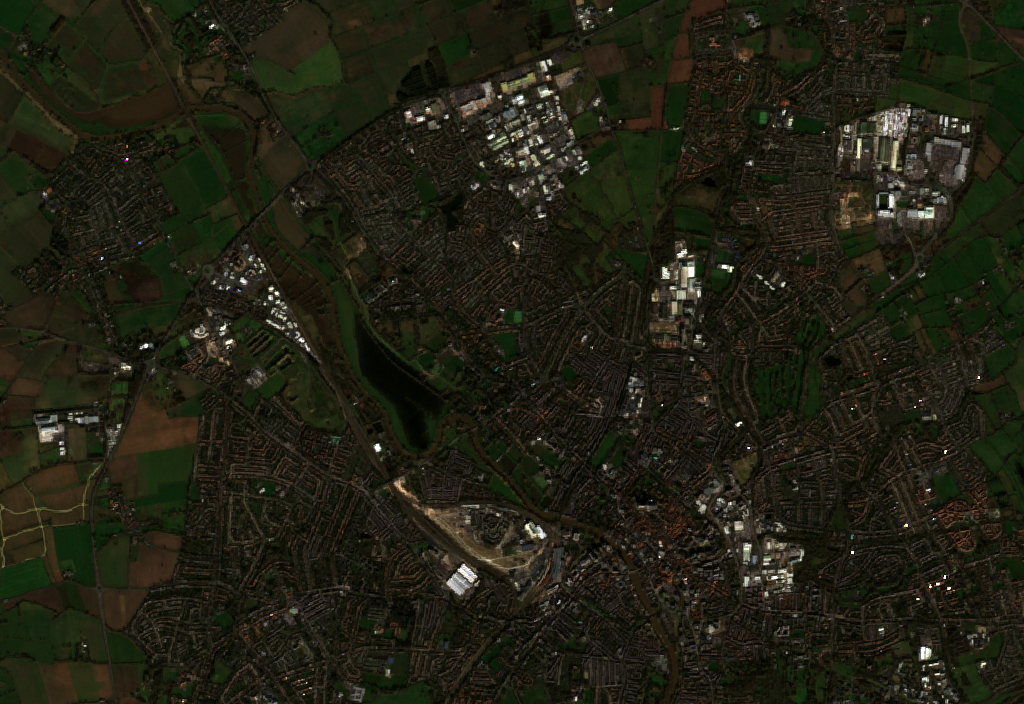
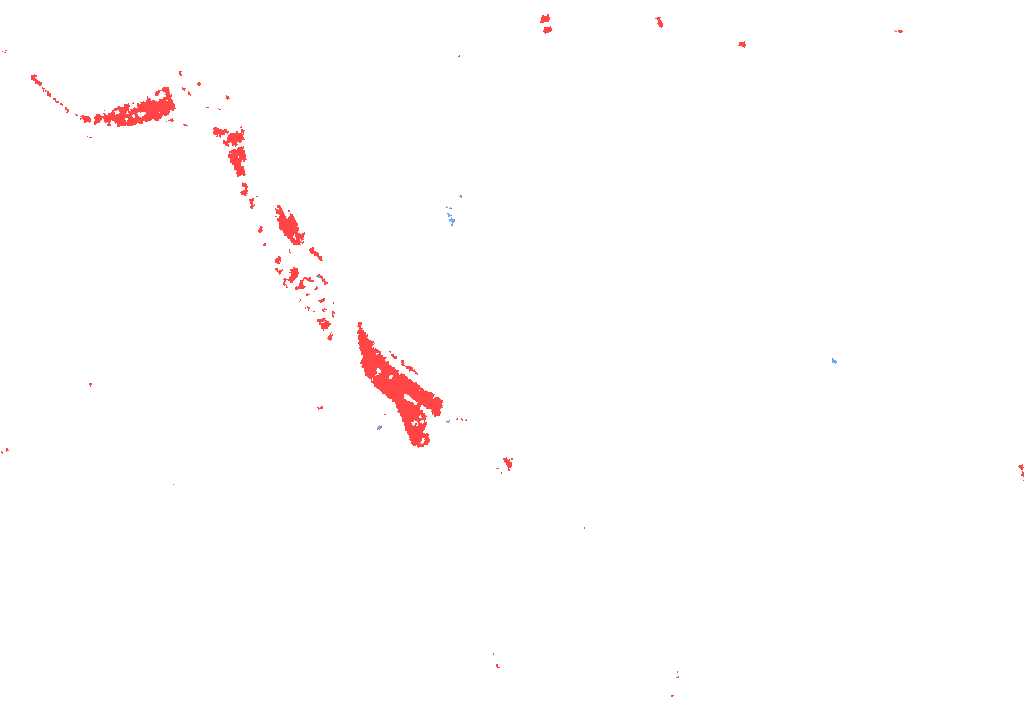
Before & After: Flood Event Detection — Mozambique (Source: NASA)
Solutions for Your Sector
We build targeted Earth observation solutions around the real problems organisations face — not around the technology.
Environmental Risk & Insurance
Insurers, Risk Analysts & Finance
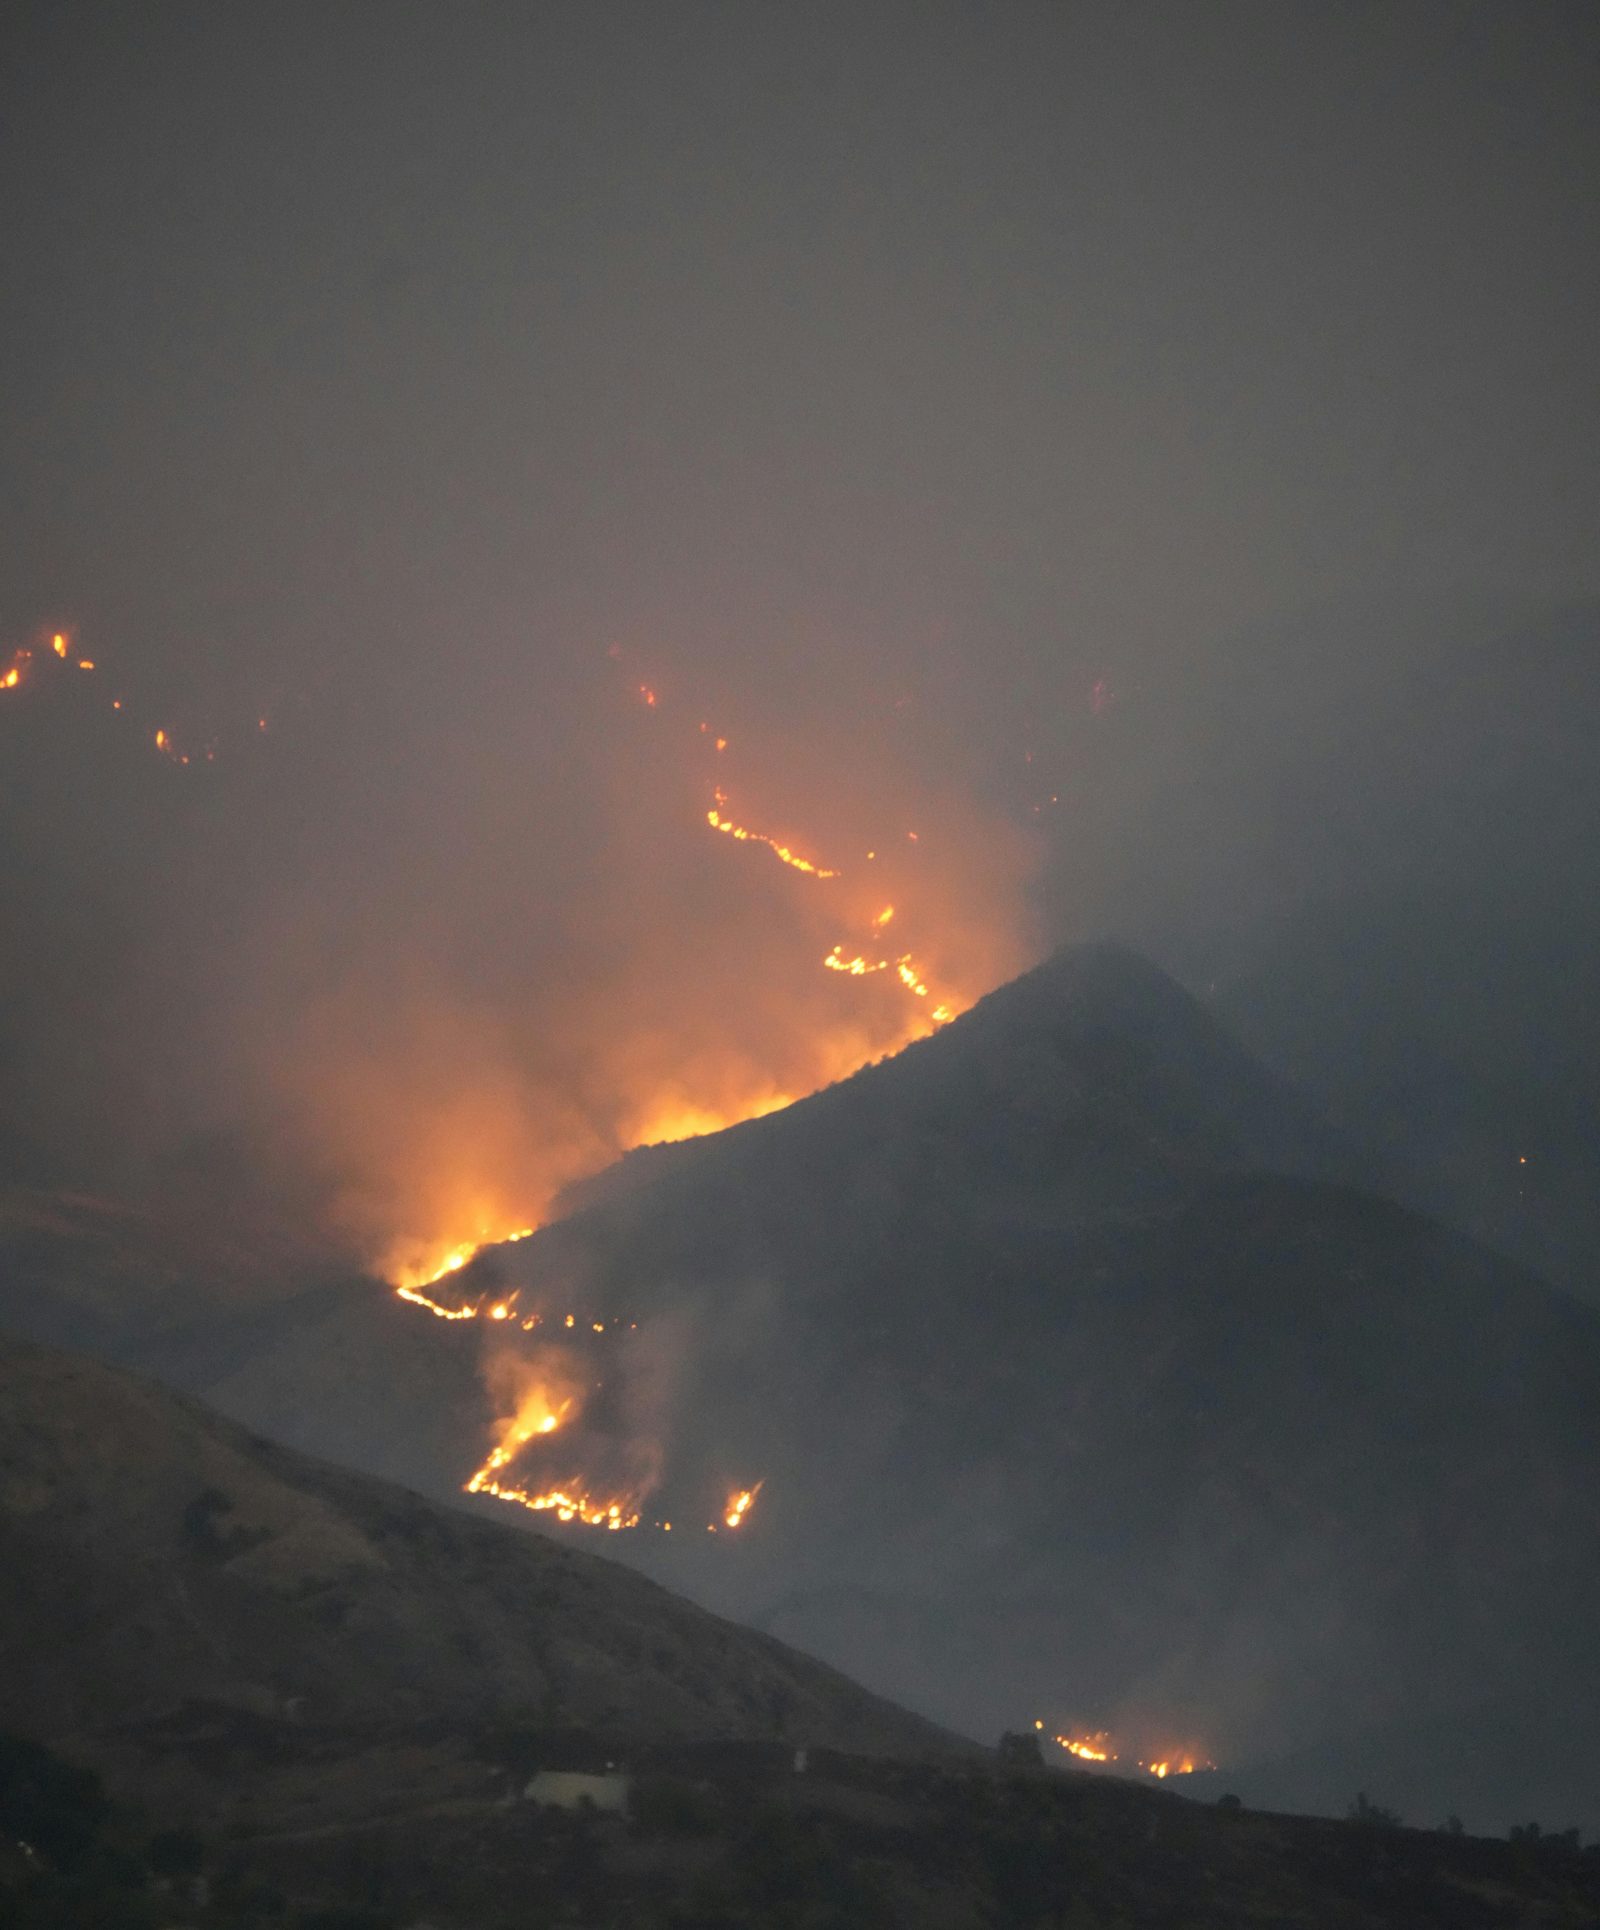
Satellite evidence for flood exposure, landslide risk, burn damage, and land surface change — at portfolio scale. Observable data, not modelled estimates.
Learn more →Flood Monitoring
Councils & Water Authorities
Detect flood events early. Map inundation extents. Keep a traceable record of flood history using SAR and optical satellite imagery — even through cloud cover.
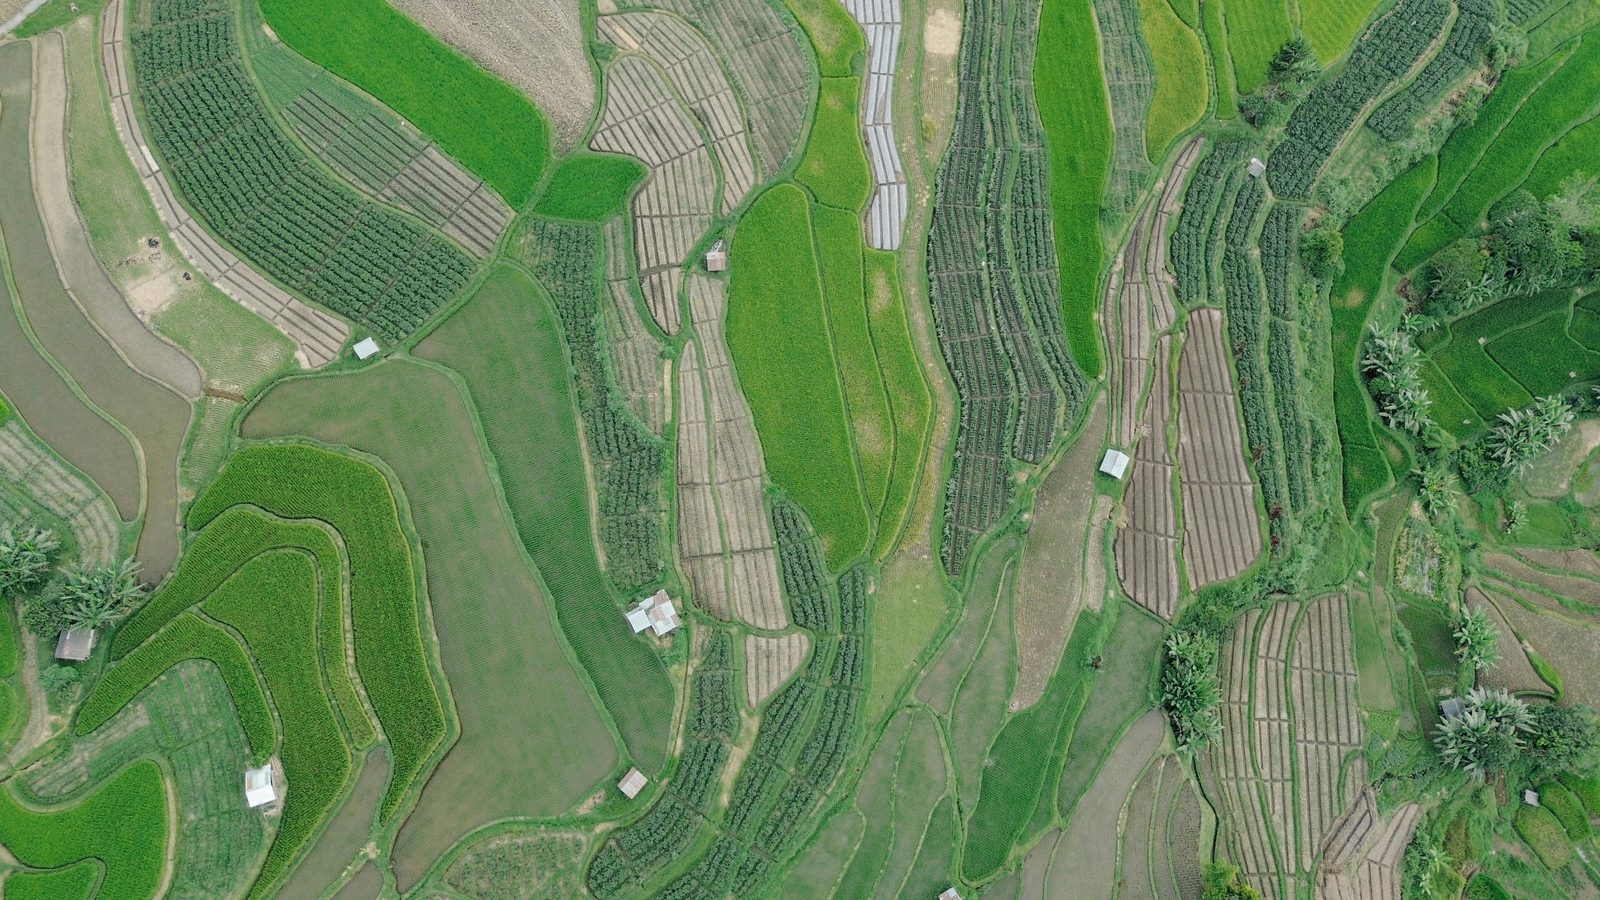
Learn more →Land & Agriculture
Farmers, Land Managers & Agri-businesses
Monitor crop health, detect land use change, and track vegetation stress across large areas — without needing boots on the ground for every check.
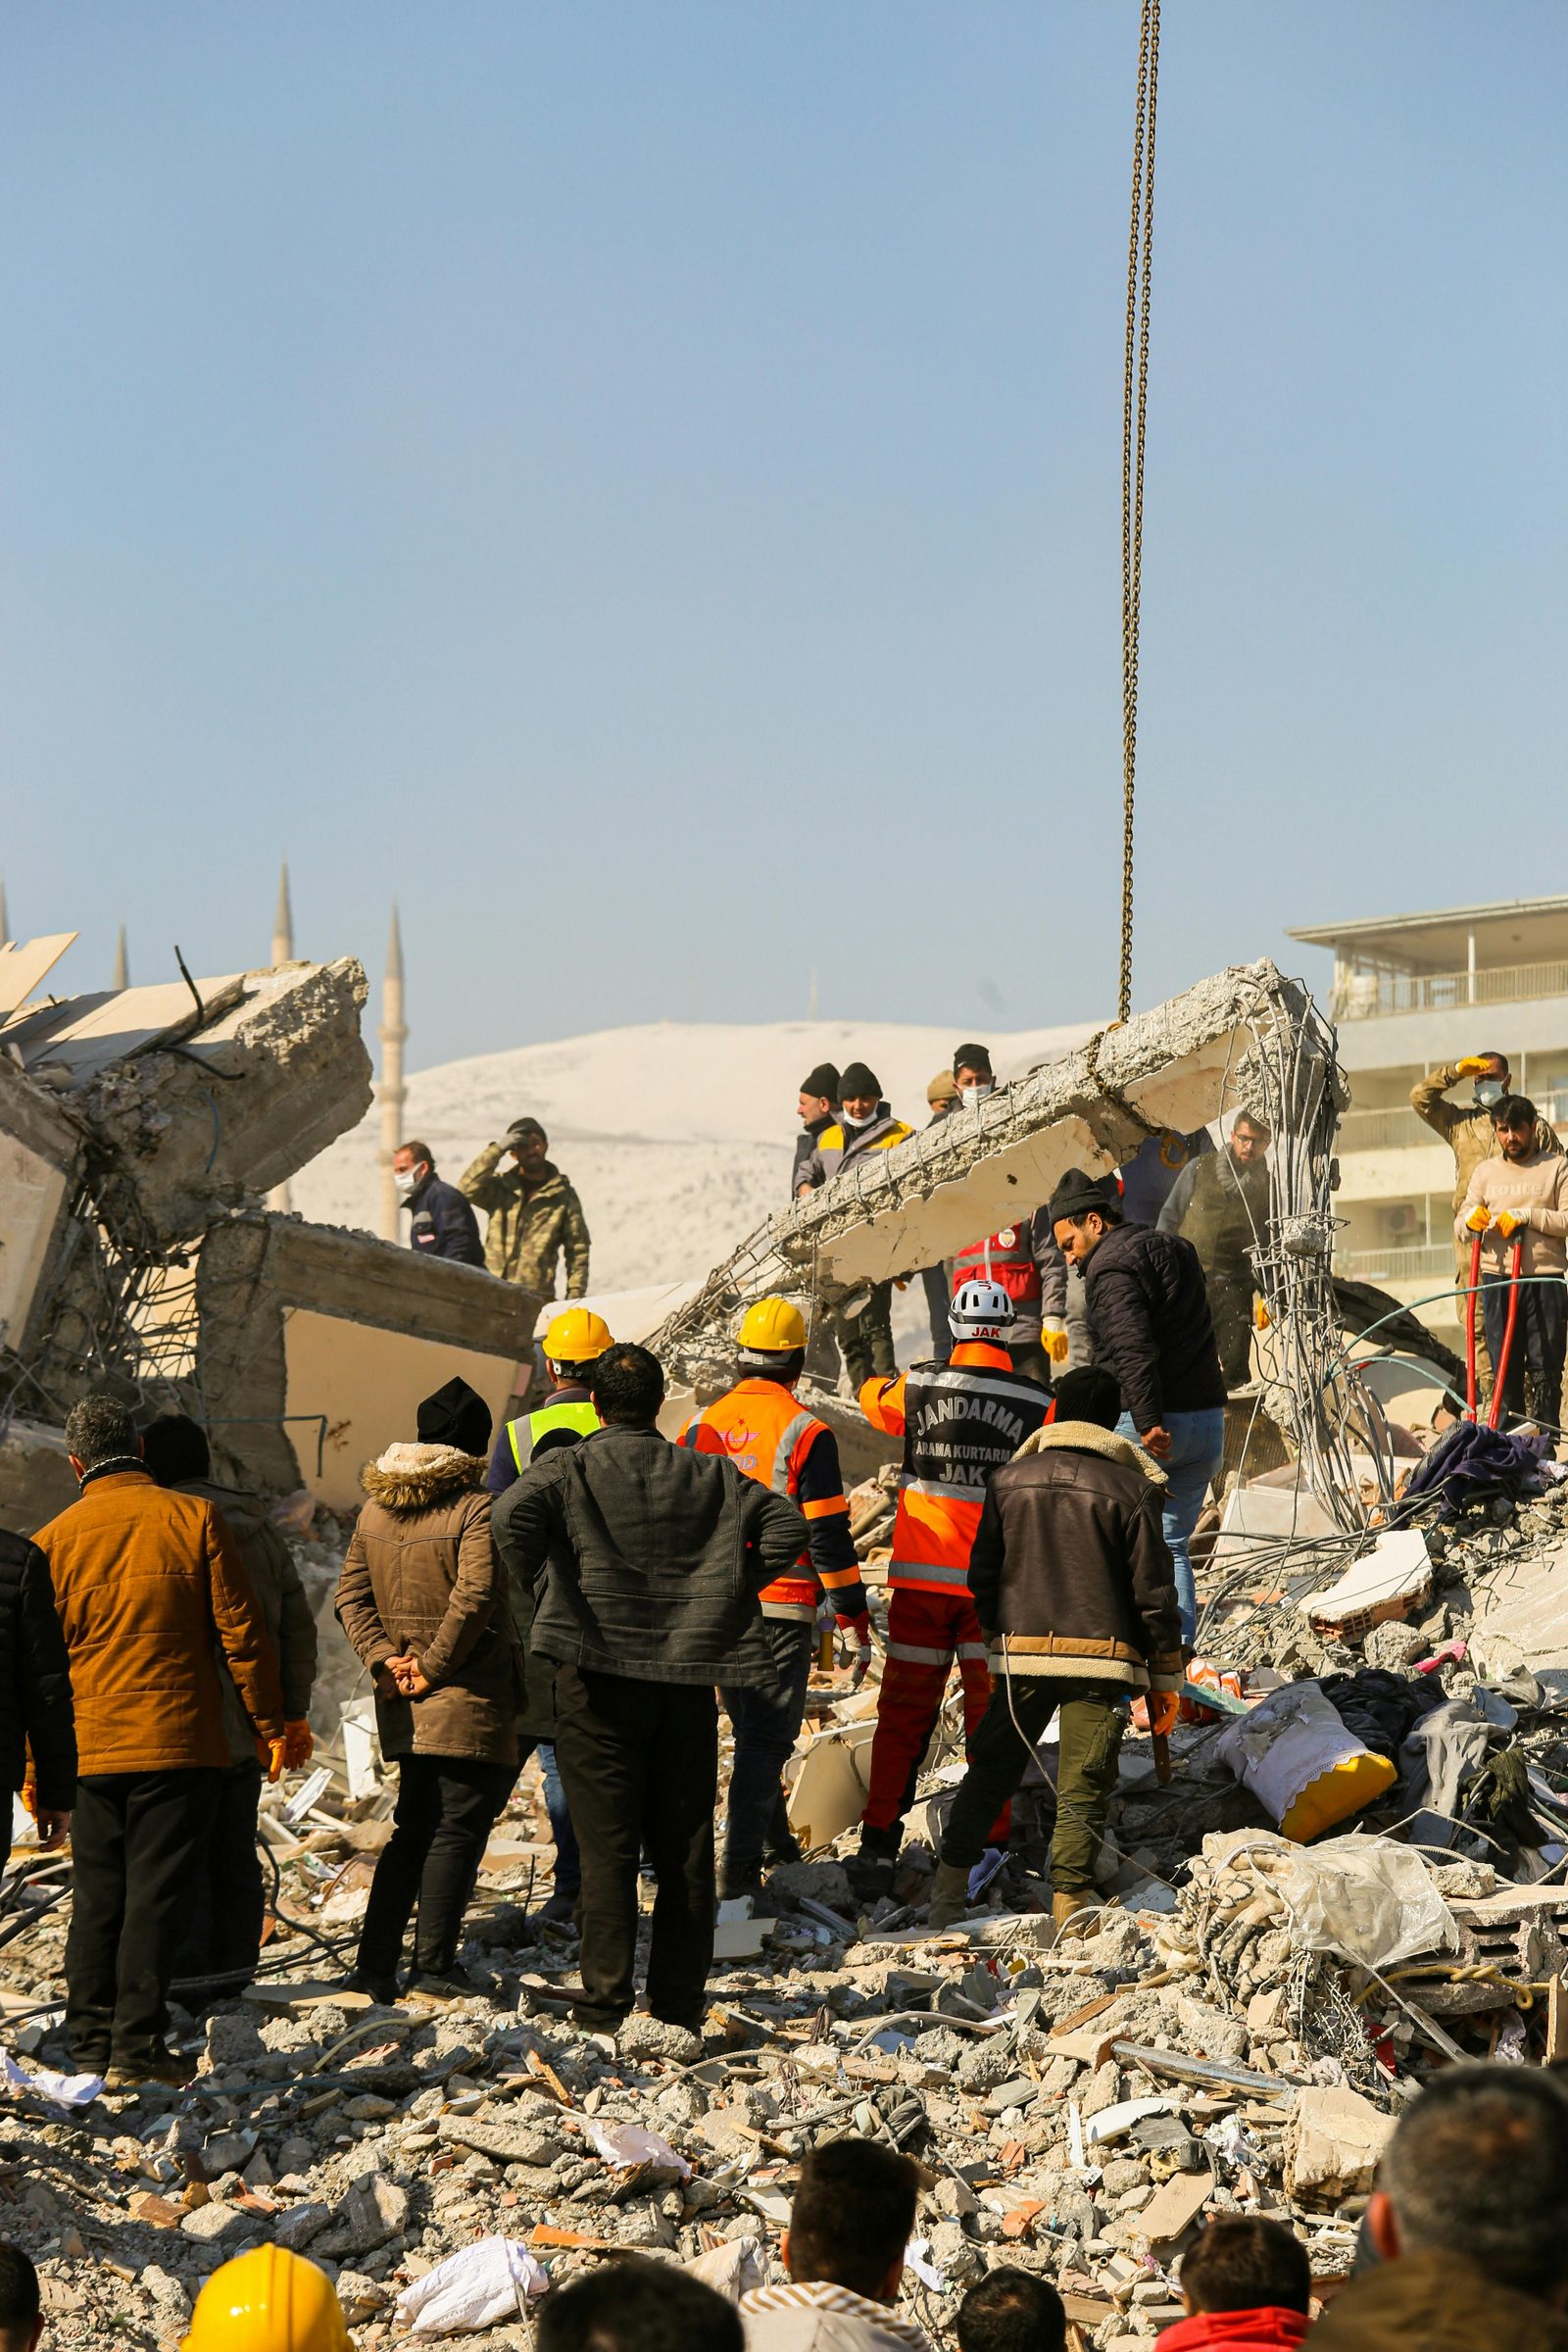
Learn more →Disaster Intelligence
NGOs, Relief Agencies & Governments
Rapid satellite analysis for disaster response — flood mapping, burn severity, displacement monitoring — delivered fast so decisions can be made when it matters.
Learn more →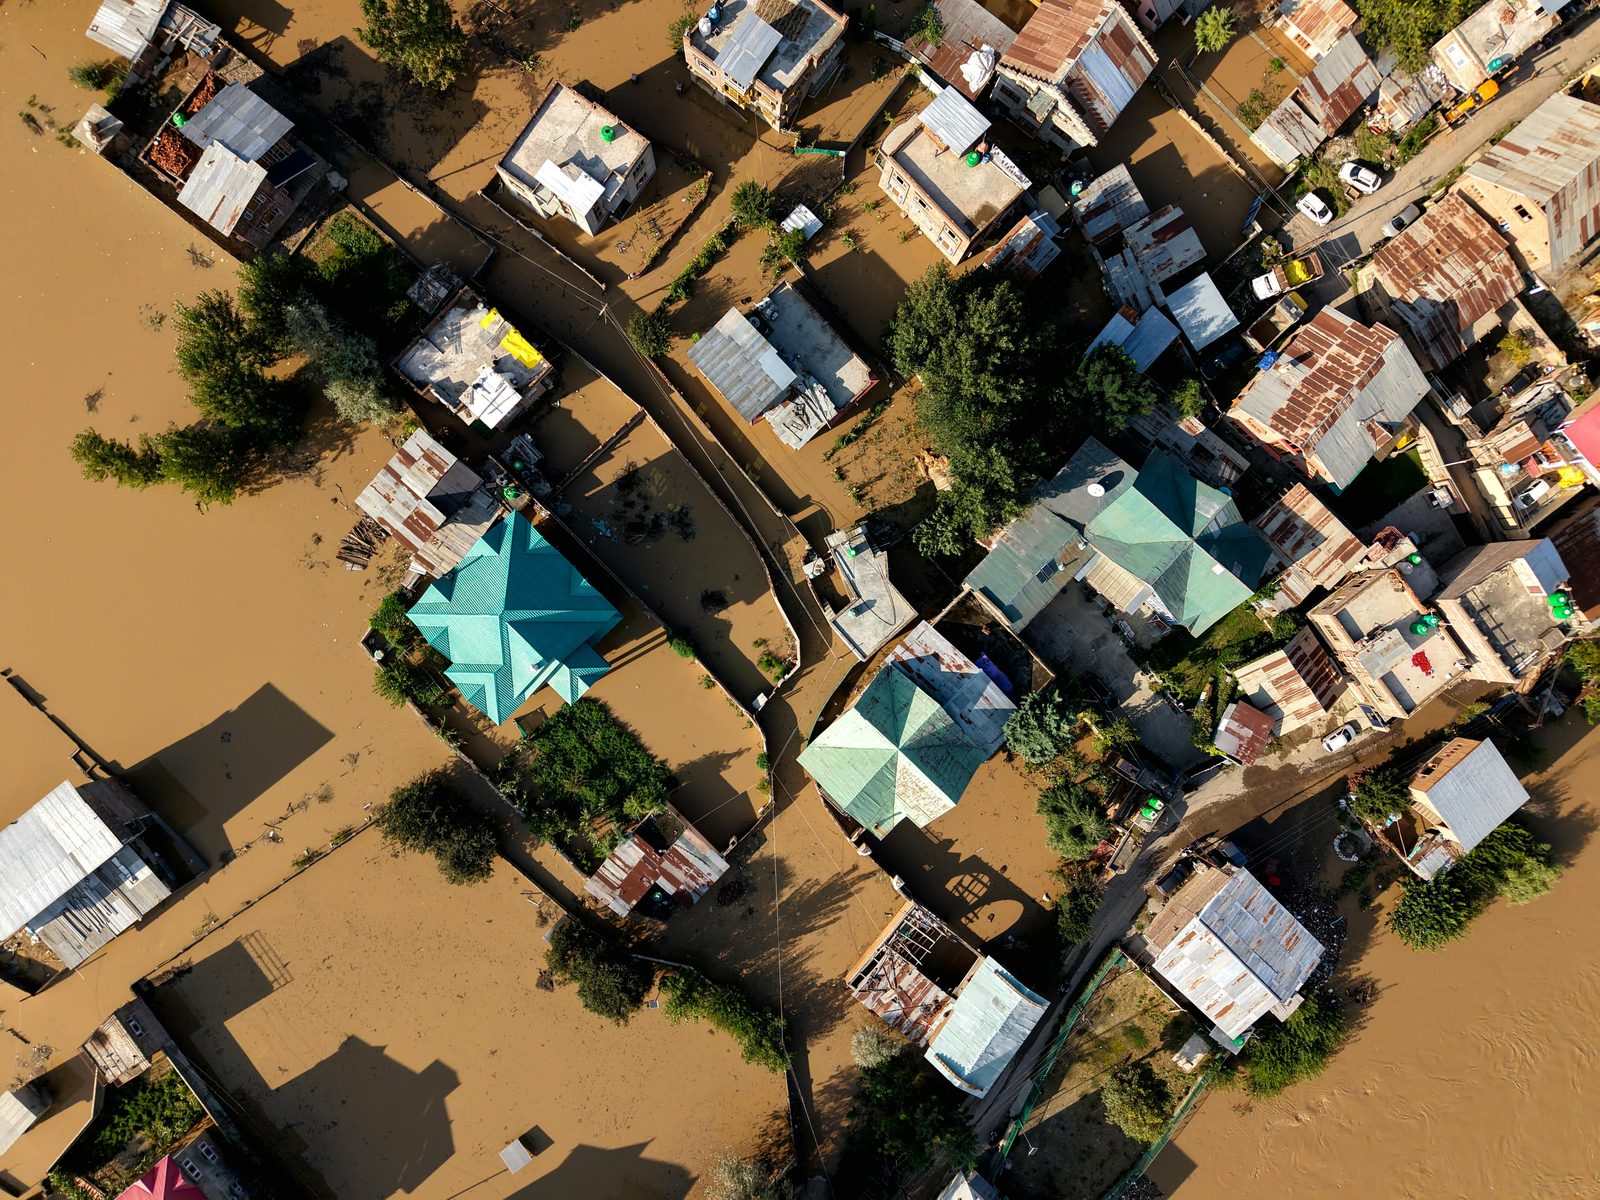
The Technology Behind Every Solution
Our platform combines SAR radar, multispectral satellite imagery, and AI interpretation — so analysis works even when optical imagery fails due to cloud cover or bad weather.
All-Weather Satellite Coverage
SAR radar sees through cloud and rain — critical for flood response in the UK and other cloud-prone regions where optical imagery often fails.
AI-Powered Interpretation
Our AI translates raw satellite data into plain-language insights, change maps, and risk summaries — so your team can act without needing EO expertise.
Multi-Index Change Detection
We measure vegetation, water, moisture, soil, and burn indicators simultaneously — giving a complete picture of what changed, where, and by how much.
Decision-Ready Outputs
Results come as maps, overlays, and summaries ready for reports and dashboards — not raw data files that need further processing.
Try the Technology Live
These tools let you explore what EOPlatform can do with real satellite data. They are live demos of the underlying technology — not the full custom solution you would receive as a client.
FloodSense™
Select an area, run the flood detection workflow, and see real SAR-based flood overlays compared against baseline imagery.
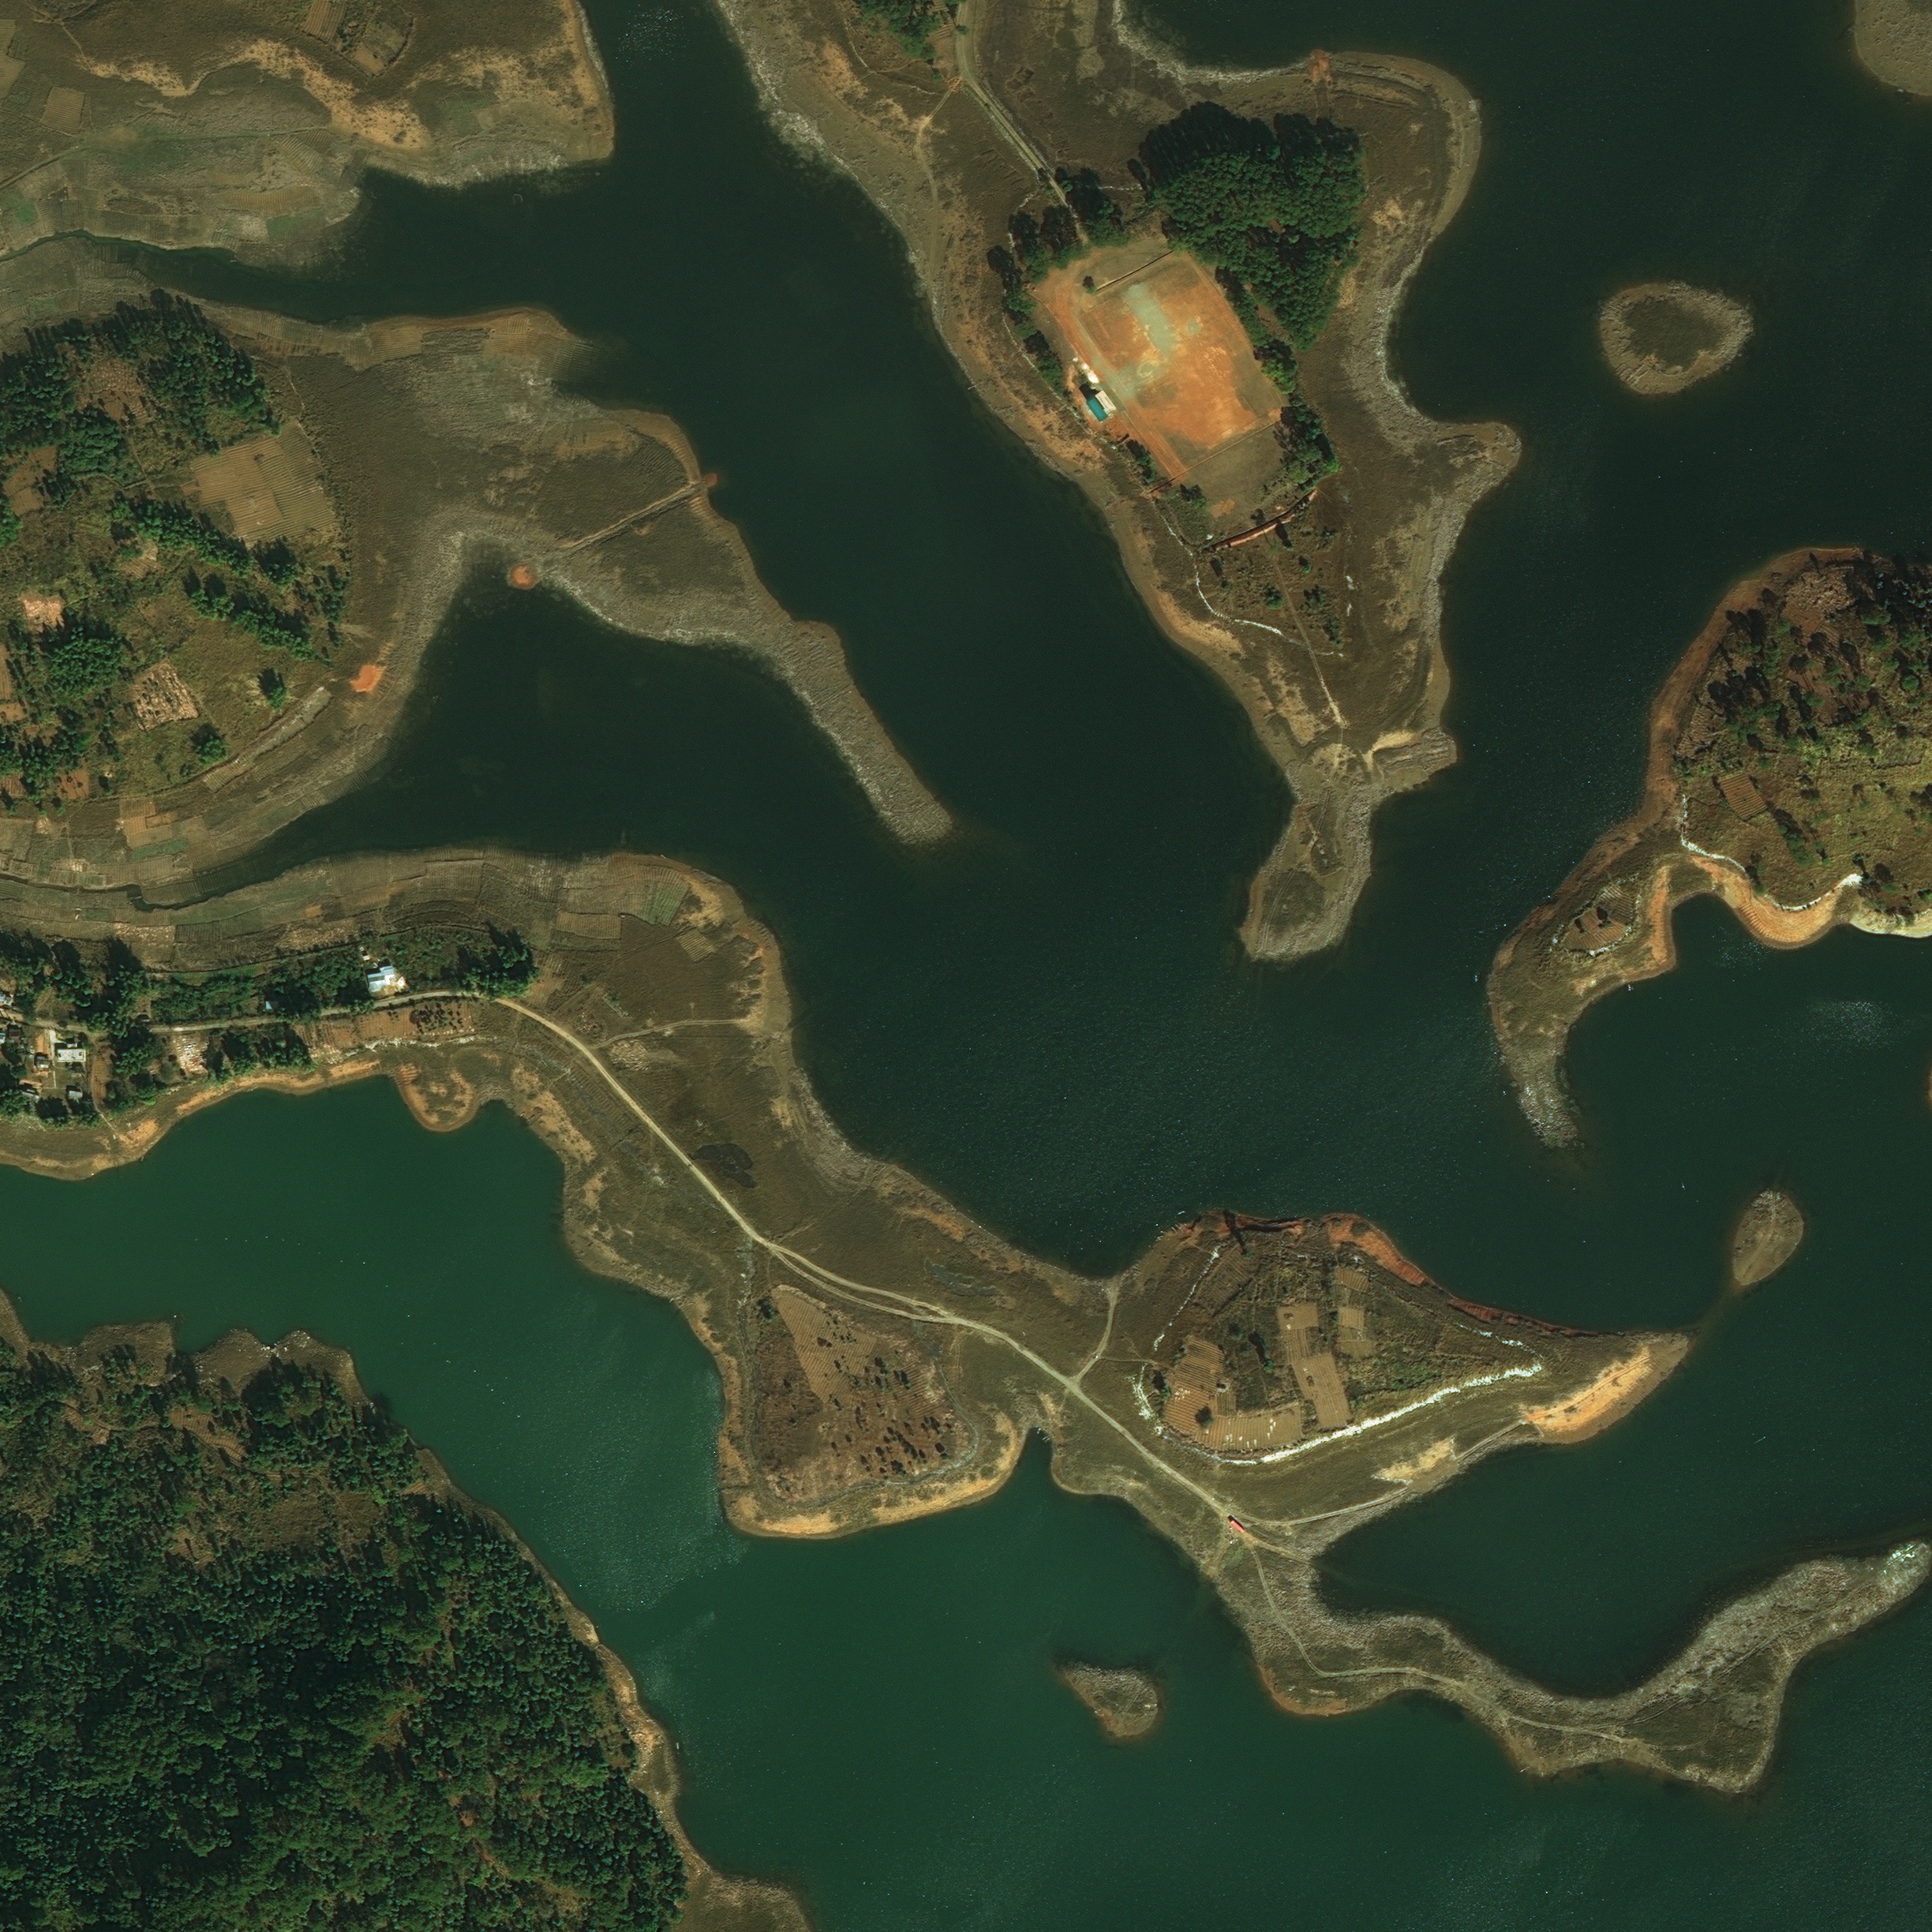
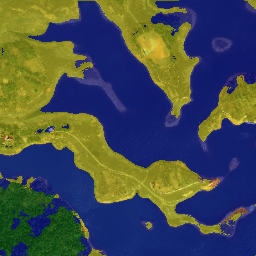
LandCover AI
Upload satellite imagery and watch our deep learning model automatically classify land cover types — vegetation, water, bare soil, and built-up area.
Multi-Index EO Analysis
Upload satellite band images from two dates and generate vegetation, water, moisture, soil, and fire indices — with interactive delta heatmaps and pixel inspection.
How We Work With You
Custom Solutions, Not Just Software
Most organisations don't need a satellite data platform — they need answers to a specific problem. That's why our primary offer is a custom solution delivery service: we scope your problem, build a tailored EO workflow, and deliver analysis you can actually use.
Whether that becomes a repeating monitoring service, an integrated data feed, or a one-off analysis project — we design it around your needs, not around our toolset.
We design and deliver bespoke satellite analysis workflows for your specific use case and area of interest.
We connect satellite outputs to your existing systems, dashboards, or GIS tools via API.
Not sure what's possible? We'll map out what satellite data can and can't tell you — then advise on the right approach.
"We don't start with the satellite. We start with the problem you're trying to solve."
— EOPlatform, iGears LimitedHave a monitoring challenge? Let's talk.
Tell us the problem — flood risk, land monitoring, environmental reporting, or anything else. We'll tell you honestly what's possible with satellite data and what it would take to build it.